| Underlying profit before tax1 | Profit before income tax and non-underlying items as shown in the Group Income Statement. | The Board considers that this measurement of profitability provides stakeholders with information on trends and performance, before the effect of non-underlying items. | Underlying profit before tax declined -4.9% year on year driven by the Retail business which saw sales decline as a result of mild winter temperatures and falling consumer confidence as Brexit uncertainty continued. | 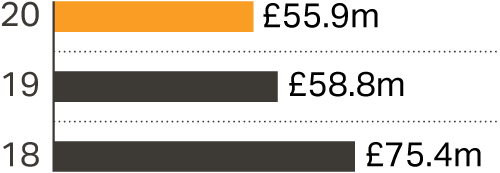 |
| Underlying earnings per share ("EPS")1 | Profit after income tax and before non-underlying items as shown in the Group Income Statement, divided by the number of shares in issue. | EPS is a measure of our investment thesis and, as such, we aim to manage revenues, margins and invest in long-term growth. | Underlying earnings per share were 24.3p, a decrease of -0.8%. | 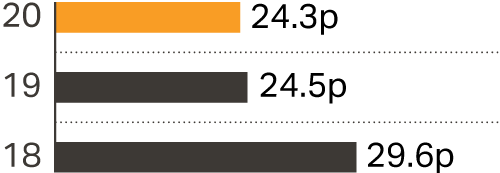 |
| Underlying EBIT and Underlying EBITDA1 | Underlying EBIT results from operating activities before non-underlying items. Underlying EBITDA further removes Depreciation and Amortisation. | The Board considers that these measurements of profitability are a viable alternative to underlying profit and uses these measures to incentivise Management. | Underlying EBIT declined -5.6% year-on-year per explanation above. EBITDA declined -3.0%. | 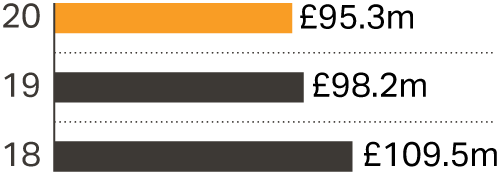
The above numbers represent Underlying EBITDA |
| Dividend per Ordinary Share1 | Dividends returned to shareholders divided by the number of shares in issue. | Given the impact of COVID-19 we have suspended the dividend until visibility of the near-term outlook improves. In normal times we remain committed to paying a dividend. | In line with previous guidance, there will be a nil final dividend for the financial year ended 3 April 2020 meaning the full-year dividend is 6.18 pence. | 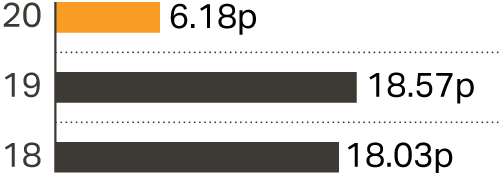 |
| Free Cash Flow2 | Adjusted Operating Cash Flow less capital expenditure, net finance costs, taxation, exchange movement and arrangement fees on loans. | Our medium-term target is to grow Free Cash Flow over the current three-year period (FY20 – FY22) compared with the previous three years (FY17 – FY19). | The Group generated a Free Cash Flow of £54.6m, +27.9% above last year. | 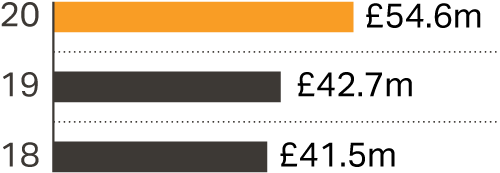 |
| Net Debt to Underlying EBITDA ratio2 | Represented by the ratio of Net Debt to Underlying EBITDA. | We currently continue to target a ratio of 1.05, with a range of up to 1.55 to allow for appropriate M&A. We will arrive at the debt target over time. This ratio helps to compare the financial result for the year to debt levels. | The Group had a Net Debt to underlying EBITDA ratio of 0.8 times at the end of FY20, having remained broadly static since 2017. | 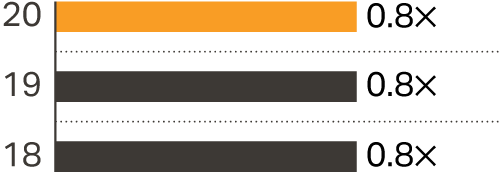 |
| Like-for-like sales1 | Revenues from stores, Autocentres and websites that have been trading for at least a year (but excluding prior year sales of stores and Autocentres closed during the year) at constant foreign exchange rates. | Like-for-like sales is a widely used indicator of a retailer's trading performance, and is a comparable measure of our year-on-year sales performance. | Group like-for-like sales declined -1.8% with Retail declining -2.3% and Autocentres in growth up +1.4%. Within Retail, Motoring declined -5.3% due to mild winter conditions in H2 whereas Cycling grew +2.3%, seeing both a strong start and end to FY20. | | FY20 LFL
sales movement | | Halfords Group | -1.8% | | Retail | -2.3% | | Motoring | -5.3% | | Cycling | 2.3% | | Autocentres | 1.4% |
|